

WAR stands for Wins Above Replacement. The premise is simple: how many wins did this player add to his team compared to a freely available replacement: the kind of guy you’d call up from Triple-A or sign off the waiver wire for the league minimum?
That last part matters. WAR doesn’t ask “how good is this player compared to average?” It asks “how much better is this player than the guy who would replace him if he went down tomorrow?” That’s a lower bar than average, which is why WAR numbers look larger than you might expect.
What goes into the number
For position players, WAR adds up five things: batting runs, baserunning runs, fielding runs, a positional adjustment, and replacement level credit. Each component is measured in runs, and roughly 10 runs equals one win, so the math converts everything into a single number you can compare across positions and eras.
That positional adjustment is the part most fans underestimate. A shortstop and a first baseman can post identical offensive numbers and the shortstop will have a higher WAR, every time. That’s because the pool of replacement-level shortstops is far weaker than the pool of replacement-level first basemen. Defense at premium positions is harder to find, so it’s worth more.
For pitchers, the formula shifts entirely. WAR asks: how many runs did this pitcher prevent, relative to what a replacement-level pitcher would have allowed, across his innings pitched? The tricky part is how you measure that: and this is where the three main versions of WAR start to diverge.
What counts as a good WAR?
Here’s the scale most analysts use for single-season values:
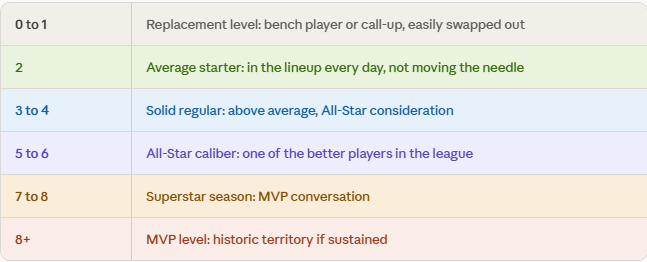
Two context points worth adding. For relief pitchers, the scale compresses significantly: a reliever at 1.5 WAR is having an outstanding season because they simply don’t pitch enough innings to accumulate value the way starters do. For starting pitchers, 2.0 WAR is the floor for a rotation-worthy season.
On the career side, 60 career WAR is the rough threshold where Hall of Fame conversations get serious. Mike Trout already has 88 career WAR and he’s still active. That’s the kind of number that reframes how we talk about generational talent.
fWAR, bWAR, and WARP: same question, different math
WAR is not one statistic. It’s a framework, and three organizations calculate it three different ways.

The biggest difference shows up in pitchers. FanGraphs uses FIP (Fielding Independent Pitching), which strips out everything a pitcher doesn’t directly control: balls in play, errors, defensive positioning. It focuses only on strikeouts, walks, hit batters, and home runs. Baseball-Reference uses RA9, which simply counts runs allowed per nine innings regardless of how outs were recorded. A groundball pitcher with elite defense behind him will look much better in bWAR than fWAR. A strikeout pitcher on a bad defensive team will look much better in fWAR.
Baseball Prospectus uses DRA (Deserved Run Average), which goes further and attempts to account for batter handedness, umpire tendencies, and ballpark conditions. It’s the most opinionated of the three systems and relies on proprietary inputs that can’t be independently verified.
For position players, the systems are closer but still diverge on defense. FanGraphs uses UZR (Ultimate Zone Rating), which incorporates multiple seasons of batted ball data. Baseball-Reference uses DRS (Defensive Runs Saved), which leans more heavily on a single season of data. In any given year a player can look like an elite defender in one system and average in the other, particularly for catchers and shortstops where defensive measurement is most complex.
None of them is definitively correct. A player with a 6.2 fWAR and a 5.8 bWAR had a very good season by either measure. The gap only becomes significant at the margins: MVP debates, Hall of Fame cases, players whose value is heavily defensive.
Why The Baseball Nerd uses fWAR
At TBN, fWAR is the default for a specific reason. Both SPARK and FADE scores are built on process over results. SPARK doesn’t care that a pitcher had a 3.20 ERA if his FIP was 4.50 and his BABIP was .240. It cares about the underlying contact quality, the strikeout trajectory, the walk rate. FIP asks the same question: what did this pitcher actually control?
Using bWAR would mean grounding the models in run prevention totals that include defensive variance, bad hops, and bullpen sequencing the pitcher had nothing to do with. fWAR keeps the signal cleaner. When you see WAR referenced anywhere in this newsletter, it’s fWAR unless stated otherwise.
A live example from the 2026 leaderboard
Eight games into the season, Andy Pages leads all of baseball at 0.97 fWAR. Wilyer Abreu is right behind him at 0.94. Chandler Simpson is in the top six at 0.81. All three are names you’d see on any leaderboard right now and think: these guys are off to a great start.
Statistical analysis tells a different story.
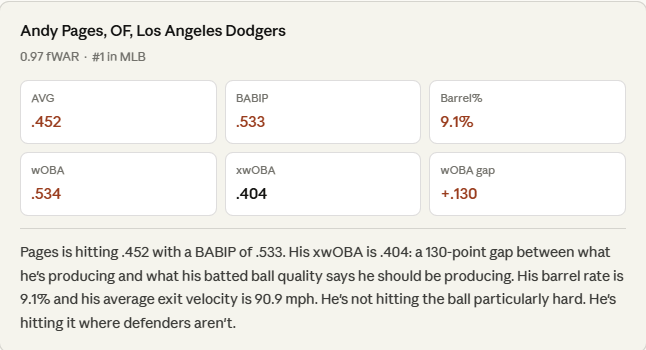
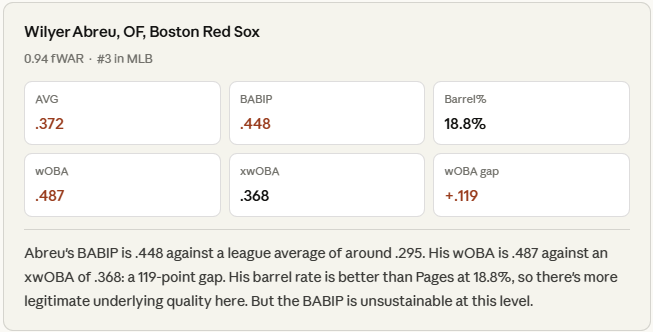
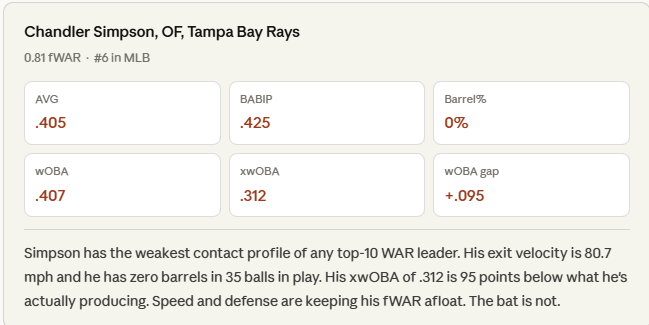
None of this means these players are bad. It means their early fWAR is being propped up by batted ball luck that the underlying metrics say is coming back to earth.
Compare those three to Yordan Alvarez: sitting at 0.95 fWAR with a wOBA of .511 and an xwOBA of .606. His xwOBA is 94 points above his actual production. He has 7 barrels in 31 balls in play and a 51.6% hard-hit rate. His SPARK score is 84.61. That gap between what he’s producing and what the contact quality says he should be producing does not close the way Pages and Simpson’s does. It closes the other way.
The WAR leaderboard eight games in is a list of names. SPARK is what separates the ones who belong there from the ones who are borrowing time. That breakdown, applied to every team, every week, is what a paid subscription delivers.

Interesting stuff!
Barrel % is new to me. How does a guy with 0% barrel have a .425 BABIP? Does that indicate that he is hitting everything off the trademark or the end of the bat?
Great explanation and application to specific player analysis. Really helpful.